Monday, September 18, 2023

Mallcom (India) Ltd (539400)- Infra & Safety Player


Mallcom (India) Ltd (539400)
closes   at 1040.45  with  a   Gain   of   +0.10%   on    15-Sep-2023  with formation of  a    Small Red  candle  on Daily  Price Chart.

About the Company : Established in 1983, Mallcom (India) Ltd. is an ISO certified and government-registered star trading house. The company is in the business of manufacturing Personal Protective Equipment and Industrial Safety products.

Sector Update :  Positive

Trendlyne Checklist Score : 45.5% Passed

Financials : Mallcom (India) Ltd has posted Net Sales / Revenue   of 410.60 Cr & Net Profit of   36.90 Cr in FY2023 and expected to post Net Sales / Revenue   of 453.00 Cr  & Net Profit of 39.50 Cr in FY2024, Net Sales / Revenue   of 521.40 Cr  & Net Profit of 46.40 in FY2025 and Net Sales / Revenue   of 600.70 Cr  & Net Profit of 58.90 Cr in FY2026.

Valuations  : The Company is now Trading at X1.60  of its  valuations of  FY2023 (Last 4 Quarters ) earnings with ~60% Premium  ;  at X1.26 of its FY2024 earnings with ~26%  Premium ; at 1.18 of its FY2025 earnings with ~18%  Premium and at X1.00 of its FY2026 earnings (Fairly Valued).

Company will increase  its Networth  of 203.20 Cr in FY 2023 to 342.40 Cr by FY 2026 along with Reduction in Debt from 90.70 to ₹63.30 Cr  and EPS will also improve from 59.19 to 94.34 during the same period.


Company is Growing +18.9% and it’s a growth candidate, as per our valuations. The growth candidate value is 1.1 ( Benchmark >1) and Growth Advantage Period ( GAP) [ >1 GAP Yes : <1 GAP No ] is 1.33

Early Trend : Infrastructure booms (Rail/road/Housing etc will create moat for it )

MF/FII : Mutual Fund – 0%. FII – 0.06%

Margin of Safety (1Yr Bond Yield: Value>1 ) is now  0.60  which  makes it a concern due to large capedx plan during 2023-2025.The  Equity Value Per Share ( Enterprise Value Method ) is  967 . It’s a Growth Stock as per our calculations , Growth Candidate ( If >1 ) is 1.10 . If We factor its FY2026 earnings/valuations, relative to current valuations,  its Price arrives at 2109.00

Disclaimer : We are / may going to take exposure shortly.

Join Us at   Telegram #   https://t.me/TheNiftyNext

Data Source NSE Website | Screener.In  | Capital Line Money Control |Refinitiv |Trendlyne |

The author tracks economic, behavioural and corporate tends, hoping to gauge good avenues of return based on Fundamental Valuations of Stocks, a follower of EPV method. You can reach me/us at | Twitter # NiftyNext1 |  e-Mail : Mail@NiftyNext.Com  |  Tel +91 8802230836  |  Telegram # TheNiftyNext  Manage your investments the right way With MProfit. Visit https://www.mprofit.inUse Our Referral Link to Get 20% DISCOUNT @ https://www.mprofit.in/buy?referral=R1GD99J496AB1345D


Wednesday, August 30, 2023

Spandana Sphoorty Financial Ltd (542759)- New customers added in Q1FY24 increased by 144% YoY

Spandana Sphoorty Financial Ltd (542759) closes   at 799.10  with  a   Fall   of   -2.70%   on    30-Aug-2023  with formation of  a    Red  candle  on Daily  Price Chart.

About the Company : Spandana Sphoorty Financial is primarily engaged in the business of micro finance providing small value unsecured loans to low-income customers in semi-urban and rural areas.

Sector Update :  Positive

Trendlyne Checklist Score : 34.80% pass

Financials : Spandana Sphoorty Financial Ltd has posted Net Interest Income (NII)  of 819.60 Cr & Net Profit of   12.40 Cr in FY2023 and expected to post NII   of 1270.30 Cr  & Net Profit of 515.40  Cr in FY2024, NII   of 1680.00 Cr  & Net Profit of 724.20 in FY2025 .

Valuations  : The Company is now Trading at X1.70  of its  valuations of  FY2023 (Last 4 Quarters ) earnings with ~70% Premium  ;  at X0.79 of its FY2024 earnings with ~21%  Discount ; at X0.57 of its FY2025 earnings with ~43%  Discount .

EPS will improve from 1.70  in FY2023 to 102 by FY2023 and RoAE from 0.2% to 5.1% ; Book Value Per Share will increase from 437 to 594 during the same period.

Early Trend : Increasing Loan Officer with opening of new office .

MF/FII : FII- 21.25; MF-0.64%

Margin of Safety (1Yr Bond Yield: Value>1 ) is now  0.60   which  will improve further..The  Equity Value Per Share ( Enterprise Value Method ) is  659.  If We factor its FY2025 earnings/valuations, relative to current valuations,  its Price arrives at 2404.00

Disclaimer : We are / may going to take exposure shortly.

Join Us at   Telegram #   https://t.me/TheNiftyNext

Data Source NSE Website | Screener.In  | Capital Line Money Control |Refinitiv |Trendlyne |

The author tracks economic, behavioural and corporate tends, hoping to gauge good avenues of return based on Fundamental Valuations of Stocks, a follower of EPV method. You can reach me/us at | Twitter # NiftyNext1 |  e-Mail : Mail@NiftyNext.Com  |  Tel +91 8802230836  |  Telegram # TheNiftyNext  Manage your investments the right way With MProfit. Visit https://www.mprofit.inUse Our Referral Link to Get 20% DISCOUNT @ https://www.mprofit.in/buy?referral=R1GD99J496AB1345D

Tuesday, August 29, 2023

Ami Organics Ltd (543349)- Electrolyte business will add value


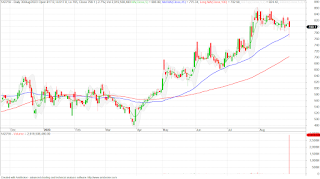
Ami Organics Ltd (543349) closes   at 1317.60  with  a   Fall  of   -1.30%   on    29-Aug-2023  with formation of  a    Red  candle  on Daily  Price Chart.

About the Company : Ami Organics Limited is one of the leading research and development-driven manufacturers of specialty chemicals. The company manufactures different types of Advanced Pharmaceutical Intermediates and Active Pharmaceutical Ingredients (API) for New Chemical Entities, and materials for agrochemicals and fine chemicals.

Sector Update :  Positive

Trendlyne Checklist Score : 50.00 % pass

Financials : Ami Organics Ltd has posted Net Sales / Revenue   of 616.70 Cr & Net Profit of   83.30 Cr in FY2023 and expected to post Net Sales / Revenue   of 753.40 Cr  & Net Profit of 97.80 Cr in FY2024, Net Sales / Revenue   of 940.20 Cr  & Net Profit of 146.10 in FY2025 and Net Sales / Revenue   of 1121.00 Cr  & Net Profit of 180.90 Cr in FY2026.

Valuations  : The Company is now Trading at X5  of its  valuations of  FY2023 (Last 4 Quarters ) earnings with ~400% Premium  ;  at X3.53 of its FY2024 earnings with ~253%  Premium ; at X2.36 of its FY2025 earnings with ~136%  Premium and at X1.91 of its FY2026 earnings with ~91%  Premium.

Company will increase  its Reserve & Surplus  of 557.50 Cr in FY 2023 to 799.80 Cr by FY 2025 along with Improvement in ROD from 14.90%  in FY 2023 to 20.60% by FY2025 and EPS from 23 to 37 during the same period.

Early Trend : Company is going through large Capex plan

MF/FII : Mutual Fund – 4.49%. FII – 6.73% ( MORGAN STANLEY ASIA SINGAPORE PTE NON ODI has purchased 621,898 shares on 29.08.2023)

Margin of Safety (1Yr Bond Yield: Value>1 ) is now  0.20  which  makes it a concern due to large capedx plan during 2023-2025.The  Equity Value Per Share ( Enterprise Value Method ) is  1301.00 . It’s a Growth Stock as per our calculations , Growth Candidate ( If >1 ) is 1.02 . If We factor its FY2026 earnings/valuations, relative to current valuations,  its Price arrives at 3450.00

Disclaimer : We are / may going to take exposure shortly.

Join Us at   Telegram #   https://t.me/TheNiftyNext

Data Source NSE Website | Screener.In  | Capital Line Money Control |Refinitiv |Trendlyne |

The author tracks economic, behavioural and corporate tends, hoping to gauge good avenues of return based on Fundamental Valuations of Stocks, a follower of EPV method. You can reach me/us at | Twitter # NiftyNext1 |  e-Mail : Mail@NiftyNext.Com  |  Tel +91 8802230836  |  Telegram # TheNiftyNext  Manage your investments the right way With MProfit. Visit https://www.mprofit.inUse Our Referral Link to Get 20% DISCOUNT @ https://www.mprofit.in/buy?referral=R1GD99J496AB1345D

Disclaimer

The recommendations made herein do not constitute an offer to sell or a solicitation to buy any of the securities mentioned. No representations can be made that the recommendations contained herein will be profitable or that they will not result in losses. Readers using the information contained herein are solely responsible for their actions. Information is obtained from sources deemed to be reliable but is not guaranteed as to accuracy and completeness. The above recommendations are based on the theory of Technical Analysis and do not reflect the fundamental validity of the Scrip. www.niftynext..com does 't take any Responsibility for any losses arising from using the Stocks Recommendations.
We( WWW.NIFTYNEXT.COM) are not Registered with Any Regulatory Body in India ie SEBI,NSE,BSE,AMFI or Any Otheres.


Blog Archive